Ververica Platform:
Self-Managed 3.0

One Major Release Powered by Three Years of Customer Feedback
Ververica's Unified Streaming Data Platform Self-Managed version 3.0 isn't an upgrade; it's a complete reimagining of what a unified streaming platform can do for real-time data teams. After listening to data engineers overwhelmed by deployment complexity, operation teams battling production issues at 3 AM, and architects losing sleep over governance and compliance audits, we built Ververica Platform 3.0 to tackle these challenges head-on.
Improvements:
Increase Your Developer Efficiency
10x faster from blank SQL editor to production deployment
Achieve Operational Excellence
90% reduction in time spent diagnosing failed jobs
Improve State Operations with the VERA Engine
97% faster snapshots, 32% faster scale-ups, 47% faster scale-downs
Build a More Reliable Platform
Real-time health visibility across every workspace and deployment
Meet Compliance Goals
30 seconds to generate complete column-level lineage for GDPR, HIPAA, CCPA, BCBS
Optimize Cost
40-60% cost reduction while maintaining Service Level Objectives (SLOs)

Ververica transforms your streaming data platform from necessary infrastructure into a competitive advantage.
Ready to watch a demo or talk to a live expert?
The Ververica Team is here to help
Powered by the VERA Engine
Enterprise-grade performance, now available in Ververica platform self-managed version 3.0
VERA is the heart of Ververica’s Streaming Data Platform, the engine that operationalizes streaming data and optimizes open source Apache Flink. VERA allows you to connect, process, analyze, and govern your data in one ultra-high-performance streaming data solution. Created to solve both batch and real-time streaming use cases, VERA makes it easy for you to harness insights from your data at any volume and scale.
Infrastructure Improvements
Gemini State Backend
With 97% faster snapshots, state migrations that once took 20 minutes now take 30 seconds.
Tiered Storage
With hot data in memory/SSD, and cold data in object storage, you'll never hit disk limits.
Key/Value Separation for Joins
Access up to 2x faster streaming joins with low match rates.
Dynamic Complex Event Processing (CEP)
Update fraud detection rules in your database table, and running jobs pick up the changes automatically with no job restart. Now you can react to threats in minutes, not days.
CDAS/CTAS (Create Table As Select)
Move data with one SQL statement: CREATE TABLE target AS SELECT * FROM source - and Ververica handles the rest: automatic schema inference, offset tracking, delivery guarantees, and seamless schema evolution.
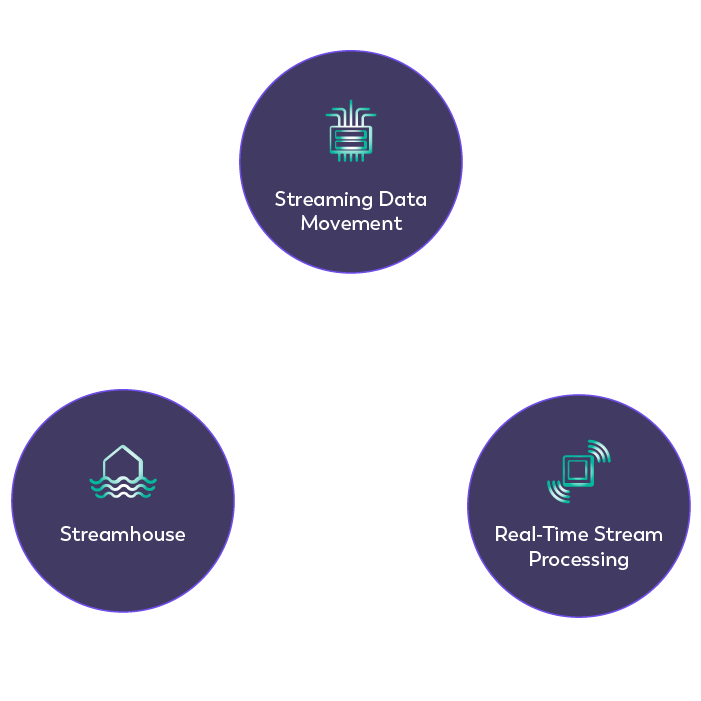
Streamhouse
Unified Streaming and Analytics
Now available in Ververica platform 3.0 as part of the VERA engine
The Problem: Your legacy data architecture is faced with an impossible choice: real-time streaming OR cost-effective analytics. You run duplicate pipelines, streaming in Apache Flink, and batch ETL to warehouses. Two systems means double the maintenance, and a permanent lag between real-time and historical data.
The Solution: Streamhouse unifies streaming and batch with a lakehouse architecture. Stream your data directly into open lakehouse table formats such as Apache Paimon or Iceberg stored in S3, GCS, or Azure Data Lake. Query in streaming mode (for millisecond latency) or batch mode (for warehouse-scale analytics). Same table. Same SQL. Zero duplication. Easier management.
Key Features:
Stream Directly to the Data Lake with ACID transactions, automatic compaction, and native change data capture (CDC) support.
Query Both Ways: Real-time dashboards and deep historical analytics on the same table.
Multi-Engine Compatibility: Flink writes streams, while Spark, Presto, Trino, and your BI tools all operate on the same tables. No duplication, no data silos.
Automatic Schema Evolution: Add columns or change types with no downtime or redeployment.
Time Travel and Audit Trails: Query tables as of a specific timestamp or snapshot ID. Easily restore previous versions for debugging, auditing, or recovery.
Unified Storage: Build one durable, cost-effective data layer. A single source of truth with no data duplication.
Developer Efficiency
Ship Faster, Break Less
Before Ververica: Data engineers spend more time fighting the platform than building pipelines. Typos in SQL? Find out at runtime. Need to test? Deploy to production and hope it goes well. Tracking deployment versions? Keep your own spreadsheet.
With Ververica: Full validation catches errors before deployment. Sandbox test with mock data to ensure you are production-ready. Utilize auto-versioning with one-click rollback. Lose zero work with auto-save.
Key Features:
Declarative CDC in YAML: Git-tracked, CI/CD-ready, reusable across environments.
SQL Validation That Works: Catch missing tables, wrong columns, and connector misconfigurations before you hit deploy.
Debug Mode with Mock Data: Upload CSV files, run SQL in isolation, see live charts, and take zero risk.
Deployment Versioning: Every deployment is auto-versioned. Track side-by-side diffs, and use one-click rollback.
Named Parameters in UDFs: Call functions like code: MyUDF(threshold => 0.95, mode => 'strict')
Native AI Inference: Call AI models directly from SQL: CREATE MODEL, ML_PREDICT(), ML_EMBED(). Access real-time sentiment analysis, RAG workflows, and semantic search, all in-pipeline.
Operational Excellence
Diagnose Problems in 60 Seconds (Instead of 45 Minutes)
Before 3.0: Ops teams live in log files, Kubernetes dashboards, and hope for the best. Any failed deployment results in 45 minutes of detective work across pods, namespaces, and external tools.
With 3.0: With one glance, your health dashboard pinpoints exactly what's wrong, where, and why, all in under 60 seconds. Get real-time notifications, centralized logs, and full visibility, no kubectl required.
Key Features:
System Health Dashboard: One glance shows Running vs. Error vs. Transitioning across all deployments.
Notification Manager: Real-time job events stream to your notifications. Filter by status. Deep-link to deployment.
Unified Event View: Cluster events, operation logs, and job failures into one timeline. Root-cause analysis goes from guesswork to definitive answers.
Separated Startup vs. Runtime Logs: Know immediately whether the problem happened during boot or execution.
Centralized Log Hub: Access JobManager and TaskManager logs, metrics, configs, thread dumps, and memory charts all in one place. Full visibility, zero kubectl commands required.
Failed TaskManager Archive: Logs persist after crashes, letting you trace root-cause OOM kills without digging into Kubernetes forensics.
Data Governance
Compliance Audits in Days, Not Months
Before 3.0: Questions like "Show us how Personally Identifiable Information (PII) flows through your system" results in weeks of grep'ing SQL files and drawing diagrams in Lucidchart. Column-level tracking? Forget it.
With 3.0: Arm your compliance officer with complete lineage graphs in 30 seconds. Click a column, and see the entire upstream and downstream flow. Export to JSON/CSV for auditors.
Key Features:
Interactive Table & Column-Level Lineage: See your entire data flow with transformations. Hover for metadata. Deep-link to deployments.
Search and Auto-Focus: Type table/field name, and the graph jumps to it. Complex environments become navigable.
Field-Level Filtering: Show only PII columns that matter. Track CPU/memory/latency per node.
One-Click Export: Export lineage to JSON/CSV. Compliance documentation packages assemble in minutes.
Built for GDPR, HIPAA, CCPA: Column-level transparency, and audit-ready out of the box.
Elasticity
The Platform That Scales Itself
Before 3.0: Scaling is manual. Traffic spiked at 9 AM? Someone has to notice, calculate new parallelism, trigger a savepoint, and redeploy. You pay for peak capacity 24/7 or suffer degraded performance.
With 3.0: Meet the platform that scales itself. Autopilot 2.0 monitors CPU, memory, and latency across any source. Adaptive mode handles unpredictable spikes. Stable mode locks in optimal configuration, while scheduled tuning follows business cycles.
Key Features:
Autopilot 2.0: Monitor any Apache Flink source (Kafka, CDC, JDBC, and files). It automatically right-sizes parallelism and memory, using two strategies:
Adaptive Strategy: Continuously optimize for unpredictable workloads (like fraud detection or IoT surges).
Stable Strategy: Converge to optimal configuration, then lock it in to support steady workloads.
Scheduled Tuning: Define time-based resource plans (including daily, weekly, and monthly). Auto-scale for peak hours, scale down overnight. Meet SLAs while cutting off-peak costs by 40%.
Dynamic Parameter Updates: Update parallelism, checkpoint settings, and timeouts on running jobs in seconds, all with zero downtime.
Unified Streaming and Analytics
Now available in Ververica platform 3.0 as part of the VERA engine
The Problem: Your legacy data architecture is faced with an impossible choice: real-time streaming OR cost-effective analytics. You run duplicate pipelines, streaming in Apache Flink, and batch ETL to warehouses. Two systems means double the maintenance, and a permanent lag between real-time and historical data.
The Solution: Streamhouse unifies streaming and batch with a lakehouse architecture. Stream your data directly into open lakehouse table formats such as Apache Paimon or Iceberg stored in S3, GCS, or Azure Data Lake. Query in streaming mode (for millisecond latency) or batch mode (for warehouse-scale analytics). Same table. Same SQL. Zero duplication. Easier management.
Key Features:
Stream Directly to the Data Lake with ACID transactions, automatic compaction, and native change data capture (CDC) support.
Query Both Ways: Real-time dashboards and deep historical analytics on the same table.
Multi-Engine Compatibility: Flink writes streams, while Spark, Presto, Trino, and your BI tools all operate on the same tables. No duplication, no data silos.
Automatic Schema Evolution: Add columns or change types with no downtime or redeployment.
Time Travel and Audit Trails: Query tables as of a specific timestamp or snapshot ID. Easily restore previous versions for debugging, auditing, or recovery.
Unified Storage: Build one durable, cost-effective data layer. A single source of truth with no data duplication.
Ship Faster, Break Less
Before Ververica: Data engineers spend more time fighting the platform than building pipelines. Typos in SQL? Find out at runtime. Need to test? Deploy to production and hope it goes well. Tracking deployment versions? Keep your own spreadsheet.
With Ververica: Full validation catches errors before deployment. Sandbox test with mock data to ensure you are production-ready. Utilize auto-versioning with one-click rollback. Lose zero work with auto-save.
Key Features:
Declarative CDC in YAML: Git-tracked, CI/CD-ready, reusable across environments.
SQL Validation That Works: Catch missing tables, wrong columns, and connector misconfigurations before you hit deploy.
Debug Mode with Mock Data: Upload CSV files, run SQL in isolation, see live charts, and take zero risk.
Deployment Versioning: Every deployment is auto-versioned. Track side-by-side diffs, and use one-click rollback.
Named Parameters in UDFs: Call functions like code: MyUDF(threshold => 0.95, mode => 'strict')
Native AI Inference: Call AI models directly from SQL: CREATE MODEL, ML_PREDICT(), ML_EMBED(). Access real-time sentiment analysis, RAG workflows, and semantic search, all in-pipeline.
Diagnose Problems in 60 Seconds (Instead of 45 Minutes)
Before 3.0: Ops teams live in log files, Kubernetes dashboards, and hope for the best. Any failed deployment results in 45 minutes of detective work across pods, namespaces, and external tools.
With 3.0: With one glance, your health dashboard pinpoints exactly what's wrong, where, and why, all in under 60 seconds. Get real-time notifications, centralized logs, and full visibility, no kubectl required.
Key Features:
System Health Dashboard: One glance shows Running vs. Error vs. Transitioning across all deployments.
Notification Manager: Real-time job events stream to your notifications. Filter by status. Deep-link to deployment.
Unified Event View: Cluster events, operation logs, and job failures into one timeline. Root-cause analysis goes from guesswork to definitive answers.
Separated Startup vs. Runtime Logs: Know immediately whether the problem happened during boot or execution.
Centralized Log Hub: Access JobManager and TaskManager logs, metrics, configs, thread dumps, and memory charts all in one place. Full visibility, zero kubectl commands required.
Failed TaskManager Archive: Logs persist after crashes, letting you trace root-cause OOM kills without digging into Kubernetes forensics.
Compliance Audits in Days, Not Months
Before 3.0: Questions like "Show us how Personally Identifiable Information (PII) flows through your system" results in weeks of grep'ing SQL files and drawing diagrams in Lucidchart. Column-level tracking? Forget it.
With 3.0: Arm your compliance officer with complete lineage graphs in 30 seconds. Click a column, and see the entire upstream and downstream flow. Export to JSON/CSV for auditors.
Key Features:
Interactive Table & Column-Level Lineage: See your entire data flow with transformations. Hover for metadata. Deep-link to deployments.
Search and Auto-Focus: Type table/field name, and the graph jumps to it. Complex environments become navigable.
Field-Level Filtering: Show only PII columns that matter. Track CPU/memory/latency per node.
One-Click Export: Export lineage to JSON/CSV. Compliance documentation packages assemble in minutes.
Built for GDPR, HIPAA, CCPA: Column-level transparency, and audit-ready out of the box.
The Platform That Scales Itself
Before 3.0: Scaling is manual. Traffic spiked at 9 AM? Someone has to notice, calculate new parallelism, trigger a savepoint, and redeploy. You pay for peak capacity 24/7 or suffer degraded performance.
With 3.0: Meet the platform that scales itself. Autopilot 2.0 monitors CPU, memory, and latency across any source. Adaptive mode handles unpredictable spikes. Stable mode locks in optimal configuration, while scheduled tuning follows business cycles.
Key Features:
Autopilot 2.0: Monitor any Apache Flink source (Kafka, CDC, JDBC, and files). It automatically right-sizes parallelism and memory, using two strategies:
Adaptive Strategy: Continuously optimize for unpredictable workloads (like fraud detection or IoT surges).
Stable Strategy: Converge to optimal configuration, then lock it in to support steady workloads.
Scheduled Tuning: Define time-based resource plans (including daily, weekly, and monthly). Auto-scale for peak hours, scale down overnight. Meet SLAs while cutting off-peak costs by 40%.
Dynamic Parameter Updates: Update parallelism, checkpoint settings, and timeouts on running jobs in seconds, all with zero downtime.

Streamhouse
Unified Streaming and Analytics
Now available in Ververica platform 3.0 as part of the VERA engine
The Problem: Your legacy data architecture is faced with an impossible choice: real-time streaming OR cost-effective analytics. You run duplicate pipelines, streaming in Apache Flink, and batch ETL to warehouses. Two systems means double the maintenance, and a permanent lag between real-time and historical data.
The Solution: Streamhouse unifies streaming and batch with a lakehouse architecture. Stream your data directly into open lakehouse table formats such as Apache Paimon or Iceberg stored in S3, GCS, or Azure Data Lake. Query in streaming mode (for millisecond latency) or batch mode (for warehouse-scale analytics). Same table. Same SQL. Zero duplication. Easier management.
Key Features:
- Stream Directly to the Data Lake with ACID transactions, automatic compaction, and native change data capture (CDC) support.
- Query Both Ways: Real-time dashboards and deep historical analytics on the same table.
- Multi-Engine Compatibility: Flink writes streams, while Spark, Presto, Trino, and your BI tools all operate on the same tables. No duplication, no data silos.
- Automatic Schema Evolution: Add columns or change types with no downtime or redeployment.
- Time Travel and Audit Trails: Query tables as of a specific timestamp or snapshot ID. Easily restore previous versions for debugging, auditing, or recovery.
- Unified Storage: Build one durable, cost-effective data layer. A single source of truth with no data duplication.

Developer Efficiency
Ship Faster, Break Less
Before Ververica: Data engineers spend more time fighting the platform than building pipelines. Typos in SQL? Find out at runtime. Need to test? Deploy to production and hope it goes well. Tracking deployment versions? Keep your own spreadsheet.
With Ververica: Full validation catches errors before deployment. Sandbox test with mock data to ensure you are production-ready. Utilize auto-versioning with one-click rollback. Lose zero work with auto-save.
Key Features:
- Declarative CDC in YAML: Git-tracked, CI/CD-ready, reusable across environments.
- SQL Validation That Works: Catch missing tables, wrong columns, and connector misconfigurations before you hit deploy.
- Debug Mode with Mock Data: Upload CSV files, run SQL in isolation, see live charts, and take zero risk.
- Deployment Versioning: Every deployment is auto-versioned. Track side-by-side diffs, and use one-click rollback.
- Named Parameters in UDFs: Call functions like code:
MyUDF(threshold => 0.95, mode => 'strict') - Native AI Inference: Call AI models directly from SQL:
CREATE MODEL,ML_PREDICT(),ML_EMBED(). Access real-time sentiment analysis, RAG workflows, and semantic search, all in-pipeline.

Operational Excellence
Diagnose Problems in 60 Seconds (Instead of 45 Minutes)
Before 3.0: Ops teams live in log files, Kubernetes dashboards, and hope for the best. Any failed deployment results in 45 minutes of detective work across pods, namespaces, and external tools.
With 3.0: With one glance, your health dashboard pinpoints exactly what's wrong, where, and why, all in under 60 seconds. Get real-time notifications, centralized logs, and full visibility, no kubectl required.
Key Features:
- System Health Dashboard: One glance shows Running vs. Error vs. Transitioning across all deployments.
- Notification Manager: Real-time job events stream to your notifications. Filter by status. Deep-link to deployment.
- Unified Event View: Cluster events, operation logs, and job failures into one timeline. Root-cause analysis goes from guesswork to definitive answers.
- Separated Startup vs. Runtime Logs: Know immediately whether the problem happened during boot or execution.
- Centralized Log Hub: Access JobManager and TaskManager logs, metrics, configs, thread dumps, and memory charts all in one place. Full visibility, zero kubectl commands required.
- Failed TaskManager Archive: Logs persist after crashes, letting you trace root-cause OOM kills without digging into Kubernetes forensics.
Ready to watch a demo or talk to a live expert?
The Ververica Team is here to help

Data Governance
Compliance Audits in Days, Not Months
Before 3.0: Questions like "Show us how Personally Identifiable Information (PII) flows through your system" results in weeks of grep'ing SQL files and drawing diagrams in Lucidchart. Column-level tracking? Forget it.
With 3.0: Arm your compliance officer with complete lineage graphs in 30 seconds. Click a column, and see the entire upstream and downstream flow. Export to JSON/CSV for auditors.
Key Features:
- Interactive Table & Column-Level Lineage: See your entire data flow with transformations. Hover for metadata. Deep-link to deployments.
- Search and Auto-Focus: Type table/field name, and the graph jumps to it. Complex environments become navigable.
- Field-Level Filtering: Show only PII columns that matter. Track CPU/memory/latency per node.
- One-Click Export: Export lineage to JSON/CSV. Compliance documentation packages assemble in minutes.
- Built for GDPR, HIPAA, CCPA: Column-level transparency, and audit-ready out of the box.

Elasticity
The Platform That Scales Itself
Before 3.0: Scaling is manual. Traffic spiked at 9 AM? Someone has to notice, calculate new parallelism, trigger a savepoint, and redeploy. You pay for peak capacity 24/7 or suffer degraded performance.
With 3.0: Meet the platform that scales itself. Autopilot 2.0 monitors CPU, memory, and latency across any source. Adaptive mode handles unpredictable spikes. Stable mode locks in optimal configuration, while scheduled tuning follows business cycles.
Key Features:
- Autopilot 2.0: Monitor any Apache Flink source (Kafka, CDC, JDBC, and files). It automatically right-sizes parallelism and memory, using two strategies:
- Adaptive: Continuously optimize for unpredictable workloads (like fraud detection or IoT surges).
- Stable: Converge to optimal configuration, then lock it in to support steady workloads.
- Scheduled Tuning: Define time-based resource plans (including daily, weekly, and monthly). Auto-scale for peak hours, scale down overnight. Meet SLAs while cutting off-peak costs by 40%.
- Dynamic Parameter Updates: Update parallelism, checkpoint settings, and timeouts on running jobs in seconds, all with zero downtime.
Watch Vererica Platform Self-Managed 3.0 announcement
You may also like
Ververica Platform 3.0: The Turning Point for Unified Streaming Data
End the batch vs streaming divide. Flink-powered lakehouse with 5-10× fas...
Introducing Apache Fluss™ on Ververica’s Unified Streaming Data Platform
Discover how Apache Fluss™ transforms Ververica's Unified Streaming Data ...
VERA-X: Introducing the First Native Vectorized Apache Flink® Engine
Discover VERA-X, the groundbreaking native vectorized engine for Apache F...
Alibaba Cloud, Ververica, Confluent, and LinkedIn Join Forces on the Streaming AI Agents Innovation with Apache Flink®
Alibaba Cloud, Ververica, Confluent, and LinkedIn collaborate to launch A...
Let’s Talk
Ververica's Unified Streaming Data Platform helps organizations to create more value from their data, faster than ever. Generally, our customers are up and running in days and immediately start to see positive impact.
Once you submit this form, we will get in touch with you and arrange a follow-up call to demonstrate how our Platform can solve your particular use case.


