


This post originally appeared on the Apache Flink blog. It was reproduced here under the Apache License, Version 2.0.
This blog post provides an introduction to Apache Flink’s built-in monitoring and metrics system, that allows developers to effectively monitor their Flink jobs. Oftentimes, the task of picking the relevant metrics to monitor a Flink application can be overwhelming for a DevOps team that is just starting with stream processing and Apache Flink. Having worked with many organizations that deploy Flink at scale, I would like to share my experience and some best practice with the community.
With business-critical applications running on Apache Flink, performance monitoring becomes an increasingly important part of a successful production deployment. It ensures that any degradation or downtime is immediately identified and resolved as quickly as possible.
Monitoring goes hand-in-hand with observability, which is a prerequisite for troubleshooting and performance tuning. Nowadays, with the complexity of modern enterprise applications and the speed of delivery increasing, an engineering team must understand and have a complete overview of its applications’ status at any given point in time.
Flink’s Metrics System
The foundation for monitoring Flink jobs is its metrics system which consists of two components; Metrics and MetricsReporters.
Metrics
Flink comes with a comprehensive set of built-in metrics such as:
-
Used JVM Heap / NonHeap / Direct Memory (per Task-/JobManager)
-
Number of Job Restarts (per Job)
-
Number of Records Per Second (per Operator)
-
…
These metrics have different scopes and measure more general (e.g. JVM or operating system) as well as Flink-specific aspects.
As a user, you can and should add application-specific metrics to your functions. Typically these include counters for the number of invalid records or the number of records temporarily buffered in managed state. Besides counters, Flink offers additional metrics types like gauges and histograms. For instructions on how to register your own metrics with Flink’s metrics system please check out Flink’s documentation. In this blog post, we will focus on how to get the most out of Flink’s built-in metrics.
MetricsReporters
All metrics can be queried via Flink’s REST API. However, users can configure MetricsReporters to send the metrics to external systems. Apache Flink provides reporters to the most common monitoring tools out-of-the-box including JMX, Prometheus, Datadog, Graphite and InfluxDB. For information about how to configure a reporter check out Flink’s MetricsReporter documentation.
In the remaining part of this blog post, we will go over some of the most important metrics to monitor your Apache Flink application.
Monitoring General Health
The first thing you want to monitor is whether your job is actually in a RUNNINGstate. In addition, it pays off to monitor the number of restarts and the time since the last restart.
Generally speaking, successful checkpointing is a strong indicator of the general health of your application. For each checkpoint, checkpoint barriers need to flow through the whole topology of your Flink job, and events and barriers cannot overtake each other. Therefore, a successful checkpoint shows that no channel is fully congested.
Key Metrics
|
Metric |
Scope |
Description |
|
uptime |
job |
The time that the job has been running without interruption. |
|
fullRestarts |
job |
The total number of full restarts since this job was submitted. |
|
numberOfCompletedCheckpoints |
job |
The number of successfully completed checkpoints. |
|
numberOfFailedCheckpoints |
job |
The number of failed checkpoints. |
Example Dashboard Panels
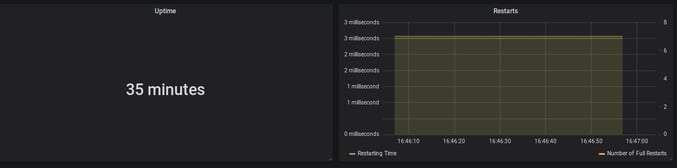 Figure 1: Uptime (35 minutes), Restarting Time (3 milliseconds) and Number of Full Restarts (7)
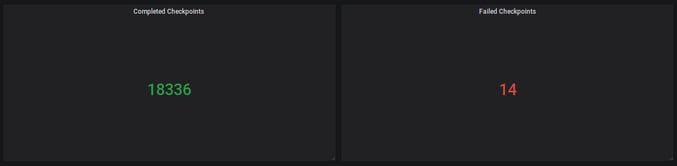 Figure 2: Completed Checkpoints (18336), Failed (14)
Possible Alerts
-
ΔfullRestarts > threshold
-
ΔnumberOfFailedCheckpoints > threshold
Monitoring Progress & Throughput
Knowing that your application is RUNNING and checkpointing is working fine is good, but it does not tell you whether the application is actually making progress and keeping up with the upstream systems.
Throughput
Flink provides multiple metrics to measure the throughput of your application. For each operator or task (remember: a task can contain multiple chained tasksFlink counts the number of records and bytes going in and out. Out of those metrics, the rate of outgoing records per operator is often the most intuitive and easiest to reason about.
Key Metrics
|
Metric |
Scope |
Description |
|
numRecordsOutPerSecond |
task |
The number of records this operator/task sends per second. |
|
numRecordsOutPerSecond |
operator |
The number of records this operator sends per second. |
Example Dashboard Panels
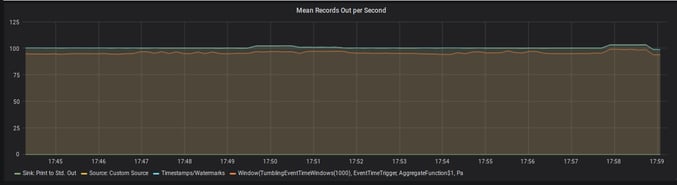 Figure 3: Mean Records Out per Second per Operator
Possible Alerts
-
recordsOutPerSecond = 0 (for a non-Sink operator)
Note: Source operators always have zero incoming records and sink operators always have zero outgoing records because the metrics only count Flink-internal communication. There is Jira ticketto change this behavior.
Progress
For applications, that use event time semantics, it is important that watermarks progress over time. A watermark of time ttells the framework, that it should not anymore expect to receive events with a timestamp earlier than t, and in turn, to trigger all operations that were scheduled for a timestamp < t. For example, an event time window that ends at t= 30 will be closed and evaluated once the watermark passes 30.
As a consequence, you should monitor the watermark at event time-sensitive operators in your application, such as process functions and windows. If the difference between the current processing time and the watermark, known as even-time skew, is unusually high, then it typically implies one of two issues. First, it could mean that your are simply processing old events, for example during catch-up after a downtime or when your job is simply not able to keep up and events are queuing up. Second, it could mean a single upstream sub-task has not sent a watermark for a long time (for example because it did not receive any events to base the watermark on), which also prevents the watermark in downstream operators to progress. This JIRA ticketprovides further information and a work around for the latter.
Key Metrics
|
Metric |
Scope |
Description |
|
currentOutputWatermark |
operator |
The last watermark this operator has emitted |
Example Dashboard Panel
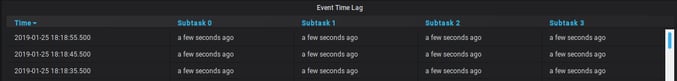 Figure 4: Event Time Lag per Subtask of a single operator in the topology. In this case, the watermark is lagging a few seconds behind for each subtask.
Possible Alerts
-
currentProcessingTime - currentOutputWatermark > threshold
“Keeping Up”
When consuming from a message queue, there is often a direct way to monitor if your application is keeping up. By using connector-specific metrics you can monitor how far behind the head of the message queue your current consumer group is. Flink forwards the underlying metrics from most sources.
Key Metrics
|
Metric |
Scope |
Description |
|
records-lag-max |
user |
applies toFlinkKafkaConsumer The maximum lag in terms of the number of records for any partition in this window. An increasing value over time is your best indication that the consumer group is not keeping up with the producers. |
|
millisBehindLatest |
user |
applies toFlinkKinesisConsumer The number of milliseconds a consumer is behind the head of the stream. For any consumer and Kinesis shard, this indicates how far it is behind the current time. |
Possible Alerts
-
records-lag-max > threshold
-
millisBehindLatest > threshold
Monitoring Latency
Generally speaking, latency is the delay between the creation of an event and the time at which results based on this event become visible. Once the event is created it is usually stored in a persistent message queue, before it is processed by Apache Flink, which then writes the results to a database or calls a downstream system. In such a pipeline, latency can be introduced at each stage and for various reasons including the following:
-
It might take a varying amount of time until events are persisted in the message queue.
-
During periods of high load or during recovery, events might spend some time in the message queue until they are processed by Flink (see previous section).
-
Some operators in a streaming topology need to buffer events for some time (e.g. in a time window) for functional reasons.
-
Each computation in your Flink topology (framework or user code), as well as each network shuffle, takes time and adds to latency.
-
If the application emits through a transactionalsink, the sink will only commit and publish transactions upon successful checkpoints of Flink, adding latency usually up to the checkpointing interval for each record.
In practice, it has proven invaluable to add timestamps to your events at multiple stages (at least at creation, persistence, ingestion by Flink, publication by Flink; possibly sampling those to save bandwidth). The differences between these timestamps can be exposed as a user-defined metric in your Flink topology to derive the latency distribution of each stage.
In the rest of this section, we will only consider latency, which is introduced inside the Flink topology and cannot be attributed to transactional sinks or events being buffered for functional reasons (4.).
To this end, Flink comes with a feature called Latency Tracking. When enabled, Flink will insert so-called latency markers periodically at all sources. For each sub-task, a latency distribution from each source to this operator will be reported. The granularity of these histograms can be further controlled by setting metrics.latency.granularityas desired.
Due to the potentially high number of histograms (in particular for metrics.latency.granularity: subtask), enabling latency tracking can significantly impact the performance of the cluster. It is recommended to only enable it to locate sources of latency during debugging.
Key Metrics
|
Metric |
Scope |
Description |
|
latency |
operator |
The latency from the source operator to this operator. |
|
restartingTime |
job |
The time it took to restart the job, or how long the current restart has been in progress. |
Example Dashboard Panel
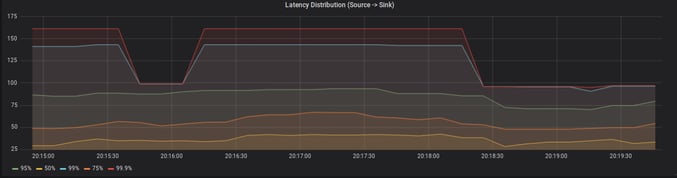 Figure 5: Latency distribution between a source and a single sink subtask.
JVM Metrics
So far we have only looked at Flink-specific metrics. As long as latency & throughput of your application are in line with your expectations and it is checkpointing consistently, this is probably everything you need. On the other hand, if your job’s performance is starting to degrade among the first metrics you want to look at, are memory consumption and CPU load of your Task- & JobManager JVMs.
Memory
Flink reports the usage of Heap, NonHeap, Direct & Mapped memory for JobManagers and TaskManagers.
-
Heap memory - as with most JVM applications - is the most volatile and important metric to watch. This is especially true when using Flink’s filesystem state backend as it keeps all state objects on the JVM Heap. If the size of long-living objects on the Heap increases significantly, this can usually be attributed to the size of your application state (check the checkpointing metricsfor an estimated size of the on-heap state). The possible reasons for growing state are very application-specific. Typically, an increasing number of keys, a large event-time skew between different input streams or simply missing state cleanup may cause growing state.
-
NonHeap memory is dominated by the metaspace, the size of which is unlimited by default and holds class metadata as well as static content. There is a JIRA Ticketto limit the size to 250 megabyte by default
-
The biggest driver of Direct memory is by far the number of Flink’s network buffers, which can be configured.
-
Mapped memory is usually close to zero as Flink does not use memory-mapped files.
In a containerized environment you should additionally monitor the overall memory consumption of the Job- and TaskManager containers to ensure they don’t exceed their resource limits. This is particularly important when using the RocksDB state backend since RocksDB allocates a considerable amount of memory off-heap. To understand how much memory RocksDB might use, you can check out one of our previous blog postsdiving deeper into RocksDB memory consumption.
Key Metrics
|
Metric |
Scope |
Description |
|
Status.JVM.Memory.NonHeap. Committed |
job-/ taskmanager |
The amount of non-heap memory guaranteed to be available to the JVM (in bytes). |
|
Status.JVM.Memory.Heap.Used |
job-/ taskmanager |
The amount of heap memory currently used (in bytes). |
|
Status.JVM.Memory.Heap.Committed |
job-/ taskmanager |
The amount of heap memory guaranteed to be available to the JVM (in bytes). |
|
Status.JVM.Memory.Direct. MemoryUsed |
job-/ taskmanager |
The amount of memory used by the JVM for the direct buffer pool (in bytes). |
|
Status.JVM.Memory.Mapped. MemoryUsed |
job-/ taskmanager |
The amount of memory used by the JVM for the mapped buffer pool (in bytes). |
|
Status.JVM.GarbageCollector.G1 Young Generation.Time |
job-/ taskmanager |
The total time spent performing G1 Young Generation garbage collection. |
|
Status.JVM.GarbageCollector.G1 Old Generation.Time |
job-/ taskmanager |
The total time spent performing G1 Old Generation garbage collection. |
Example Dashboard Panel
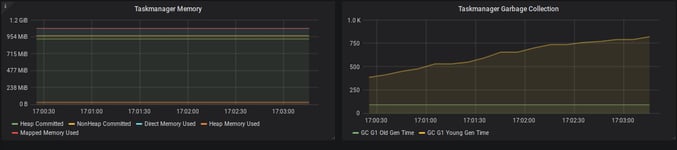 Figure 6: TaskManager memory consumption and garbage collection times.
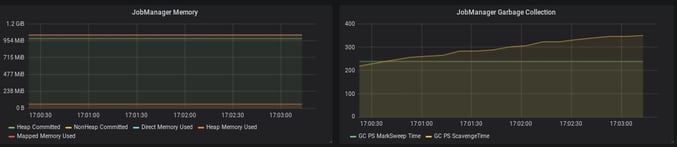 Figure 7: JobManager memory consumption and garbage collection times.
Possible Alerts
-
container memory limit < container memory + safety margin
CPU
Besides memory, you should also monitor the CPU load of the TaskManagers. If your TaskManagers are constantly under very high load, you might be able to improve the overall performance by decreasing the number of task slots per TaskManager (in case of a Standalone setup), by providing more resources to the TaskManager (in case of a containerized setup), or by providing more TaskManagers. In general, a system already running under very high load during normal operations, will need much more time to catch-up after recovering from a downtime. During this time you will see a much higher latency (event-time skew) than usual.
A sudden increase in the CPU load might also be attributed to high garbage collection pressure, which should be visible in the JVM memory metrics as well.
If one or a few TaskManagers are constantly under very high load, this can slow down the whole topology due to long checkpoint alignment times and increasing event-time skew. A common reason is skew in the partition key of the data, which can be mitigated by pre-aggregating before the shuffle or keying on a more evenly distributed key.
Key Metrics
|
Metrics |
Scope |
Description |
|
Status.JVM.CPU.Load |
job-/taskmanager |
The recent CPU usage of the JVM. |
Example Dashboard Panel
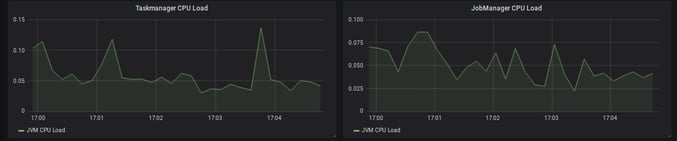 Figure 8: TaskManager & JobManager CPU load
System Resources
In addition to the JVM metrics above, it is also possible to use Flink’s metrics system to gather insights about system resources, i.e. memory, CPU & network-related metrics for the whole machine as opposed to the Flink processes alone. System resource monitoring is disabled by default and requires additional dependencies on the classpath. Please check out theFlink system resource metrics documentationfor additional guidance and details. System resource monitoring in Flink can be very helpful in setups without existing host monitoring capabilities.
Conclusion
This post tries to shed some light on Flink’s metrics and monitoring system. You can utilise it as a starting point when you first think about how to successfully monitor your Flink application. I highly recommend to start monitoring your Flink application early on in the development phase. This way you will be able to improve your dashboards and alerts over time and, more importantly, observe the performance impact of the changes to your application throughout the development phase. By doing so, you can ask the right questions about the runtime behaviour of your application, and learn much more about Flink’s internals early on.
Last but not least, this post only scratches the surface of the overall metrics and monitoring capabilities of Apache Flink. I highly recommend going over Flink’s metrics documentationfor a full reference of Flink’s metrics system.


You may also like

The Data Platform Bar Has Risen. Ververica Has Set It: Introducing Ververica Platform 3.1

Your AI Coding Assistant Can't Touch Your Streaming Platform. Until Now

Zero Trust Theater and Why Most Streaming Platforms Are Pretenders
