


This post originally appeared on the Apache Flink blog. It was reproduced here under the Apache License, Version 2.0.
This blog post describes how developers can leverage Apache Flink’s built-in metrics system together with Prometheus to observe and monitor streaming applications in an efficient way. This is a follow-up post from my Flink Forward Berlin 2018 talk (slides, video). We will cover some basic Prometheus concepts and why it is a great fit for monitoring Apache Flink stream processing jobs. There is also an example to showcase how you can utilize Prometheus with Flink to gain insights into your applications and be alerted on potential degradations of your Flink job. 
WHY PROMETHEUS?
Prometheus is an open-source metrics-based monitoring system that was originally created in 2012. The system is completely open-source with a vibrant community behind it and it has graduated from the Cloud Native Foundation last year – a sign of maturity, stability and production-readiness. As we mentioned, the system is based on metrics and it is designed to measure the overall health, behavior, and performance of a service. Prometheus features a multi-dimensional data model as well as a flexible query language. It is highly performant and can easily be deployed in traditional or containerized environments. Some of the important Prometheus concepts are:
-
Metrics: Prometheus defines metrics as floats of information that change in time. These time series have millisecond precision.
-
Labels are the key-value pairs associated with time series that support Prometheus’ flexible and powerful data model – in contrast to hierarchical data structures that one might experience with traditional metrics systems.
-
Scrape: Prometheus is a pull-based system and fetches (“scrapes”) metrics data from specified sources that expose HTTP endpoints with a text-based format.
-
PromQL is Prometheus’ query language that can be used for both building dashboards and setting up alert rules that will trigger when specific conditions are met.
When considering metrics and monitoring systems for your Flink jobs, there is a wide variety of options that can be used. Flink offers native support for exposing data to Prometheus via the PrometheusReporter configuration. Setting up this integration is very easy.
Prometheus is a great choice as usually Flink jobs are not running in isolation but in a greater context e.g. of microservices. For making metrics available to Prometheus from other parts of a larger system, there are two options: There exist libraries for all major languages to instrument other applications and there is a wide variety of exporters, i.e. tools that expose metrics of third-party systems (like databases or Apache Kafka) as Prometheus metrics.
PROMETHEUS AND FLINK IN ACTION
We have provided a GitHub repository that showcases the integration described above. To have a look, make sure Docker is available, clone the repository and run:
./gradlew composeU
This builds a Flink job using Gradle and starts up a local environment based on Docker Compose running the job in a Flink job cluster (reachable at http://localhost:8081) as well as a Prometheus instance (http://localhost:9090).
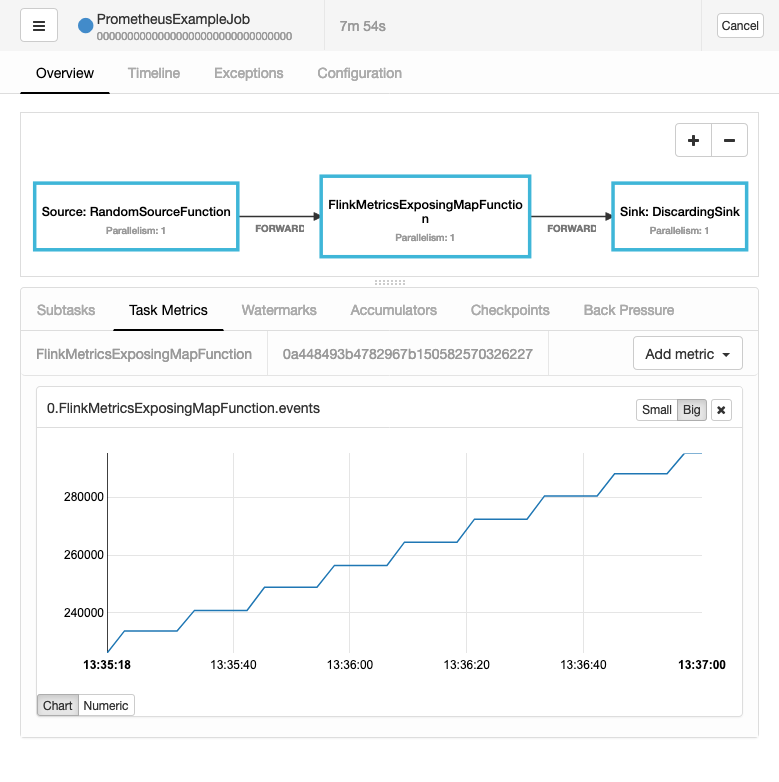
Job graph and custom metric for example job in Flink web interface.
A simple demo illustrates how easy it is to add custom metrics relevant to your business logic into your Flink job. The PrometheusExampleJob has three operators: Random numbers up to 10,000 are generated, then a map counts the events and creates a histogram of the values passed through. Finally, the events are discarded without further output. The very simple code below is from the second operator. It illustrates how easy it is to add custom metrics relevant to your business logic into your Flink job.
class FlinkMetricsExposingMapFunction extends RichMapFunction<integer, integer="">{
  private transient Counter eventCounter;

  @Override
  public void open(Configuration parameters) {
    eventCounter = getRuntimeContext().getMetricGroup().counter("events");
  }

  @Override
  public Integer map(Integer value) {
    eventCounter.inc();
    return value;
  }
}
</integer,>
Excerpt from FlinkMetricsExposingMapFunction.java demonstrating custom Flink metric.
CONFIGURING PROMETHEUS WITH FLINK
To start monitoring Flink with Prometheus, the following steps are necessary:
1. Make the PrometheusReporter jar available to the classpath of the Flink cluster:
cp /opt/flink/opt/flink-metrics-prometheus-1.7.0.jar /opt/flink/lib
metrics.reporters: prom
metrics.reporter.prom.class: org.apache.flink.metrics.prometheus.PrometheusReporter metrics.reporter.prom.port: 999
3. Prometheus needs to know where to scrape metrics. In a static scenario, you can simply configure Prometheus in prometheus.yaml with the following:
scrape_configs
 - job name: ‘flink’
  static configs:
  - targets:[‘job-cluster:9999’, ‘taskmanager1:9999’, ‘taskmanager2:9999’]
In more dynamic scenarios we recommend using Prometheus’ service discovery support for different platforms such as Kubernetes, AWS EC2 and more.
Both custom metrics are now available in Prometheus:
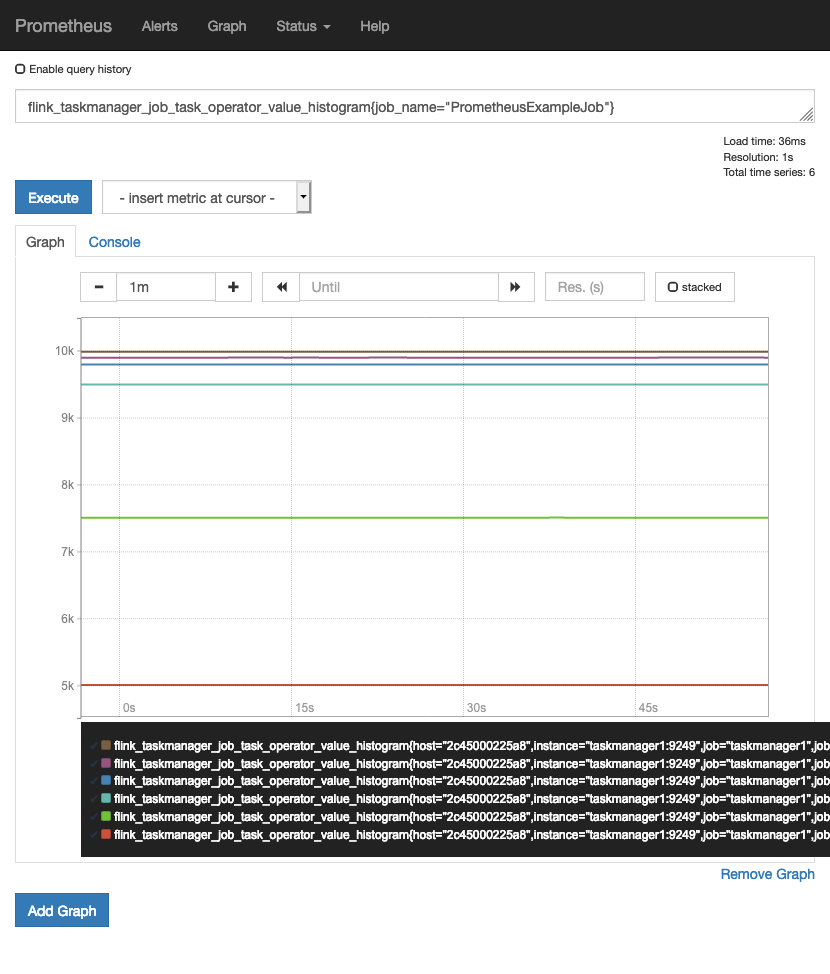
Example metric in Prometheus web UI.
More technical metrics from the Flink cluster (like checkpoint sizes or duration, Kafka offsets or resource consumption) are also available. If you are interested, you can check out the HTTP endpoints exposing all Prometheus metrics for the job managers and the two task managers on http://localhost:9249, http://localhost:9250 and http://localhost:9251, respectively.
To test Prometheus’ alerting feature, kill one of the Flink task managers via docker kill taskmanager1. Our Flink job can recover from this partial failure via the mechanism of Checkpointing. Nevertheless, after roughly one minute (as configured in the alert rule) the following alert will fire:
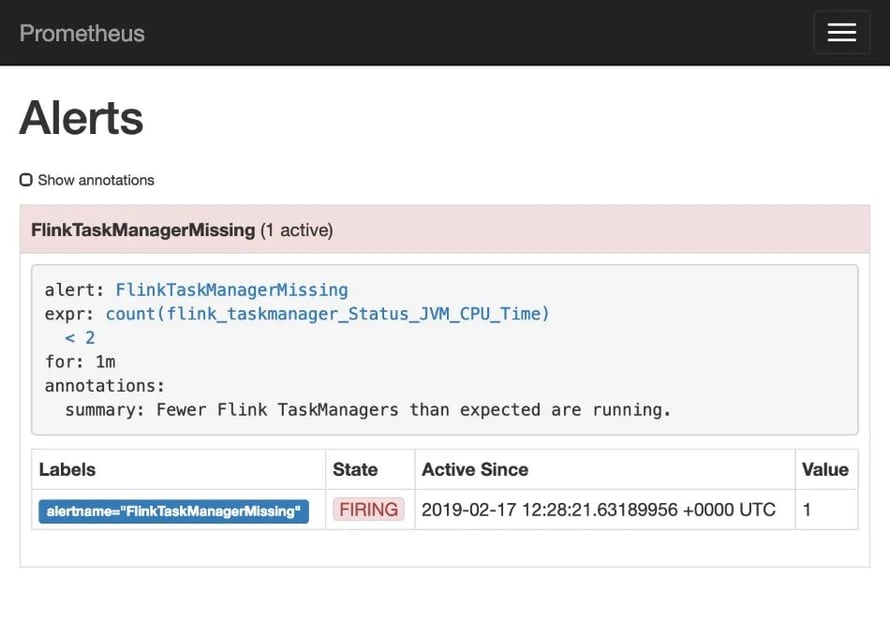
Example alert in Prometheus web UI.
In real-world situations these alerts can be routed through a component called Alertmanager and be grouped into notifications to e.g. email, PagerDuty or Slack.
Feel free to play around with the setup, and check out the Grafana instance reachable at http://localhost:3000 (credentials admin:flink) for visualizing Prometheus metrics. If there are any questions or problems, do not hesitate to create an issue. Once finished, do not forget to tear down the setup via ./gradlew composeDown
CONCLUSION
Using Prometheus together with Flink provides an easy way for effective monitoring and alerting for your Flink jobs. Both projects have exciting and vibrant communities behind them with new developments and additions scheduled for upcoming releases. We encourage you to try the two technologies together as it has immensely improved our visibility into Flink jobs running in production.


You may also like

The Data Platform Bar Has Risen. Ververica Has Set It: Introducing Ververica Platform 3.1

Your AI Coding Assistant Can't Touch Your Streaming Platform. Until Now

Zero Trust Theater and Why Most Streaming Platforms Are Pretenders
