While many fast-paced, hyper-growth tech companies such as Salesforce expand exponentially, oftentimes their application log infrastructure is evolving organically, trailing behind the operational scale of business. At the core, it typically includes a log collection pipeline, a log storage data lake and a log search system where users can perform ad-hoc queries. As companies grow, log intelligence analysis becomes another function to be supported. At the scale of Salesforce, running log intelligence using the same log infrastructure — built over the years for ingestion and ad-hoc search — tends to result in significant limitations because of multiple reasons such as:
-
The stored logs are not available immediately as a real-time stream, preventing users from detecting performance deviations and anomalies as they still happen.
-
Log retention is limited to fit short-term, ad-hoc query lifespan and cannot support historical log analysis which may require months worth of log data.
At Salesforce, the Edge Intelligence team decided to augment the company’s log infrastructure to provide application log intelligence analytics at scale, both as a real-time anomaly detection service and as an offline historical performance insights BI service. Our main goal is to make application performance analysis pro-actively: respond to real-time issues as they happen and provide insights and explanations before support tickets are opened. The core of our technical approach is based on real-time distributed log stream processing in Apache Flink. In the following sections, we explain the challenges we faced when developing our service, our approach to solving them and what our platform currently looks like.
Challenges
Flink helped us solve most of our main challenges such as:
-
The scale of our log firehose. Salesforce log ingestion allows consuming logs in a semi-structured format from thousands of geographically distributed log topics via a managed Kafka cluster. For our purposes, we have to subscribe to most of the high-volume topics, summing up to gigabytes of log lines per second. All fundamental streaming challenges apply at this scale such as: multi-region geographically distributed streaming, joining many correlated streams in real-time, managing a distributed stream state (such as join-hash or time-windows aggregates) and stream re-shuffling (group/key-by operations).
-
Scoping of application log analytics. Salesforce applications provide metadata mixed with performance metrics and free-text in the log lines: metadata always include scope dimension values (such as organization/tenant ID, application ID, region, host ID etc.). A handful of these dimensions are high-cardinality (say, hundreds of thousands of organizations), some are medium-cardinality (such as, regions and data-center IDs) and the rest are small-cardinality (small enumerations). Scoping can be hierarchical, dynamic and scoping key-by stream operations have to be distributed, balanced and have to maintain stream state for each scope key.
-
High volatility of application performance. Metric values, extracted from log lines, may be stable for a while for most of the metric scopes — but very turbulent during anomalous events for a subset of affected scopes (which constitutes the main interest for real-time analysis). Moreover, there are often trends seen in many scopes (regime-shifting, up/down-ward drifting or mean-reverting slowly) which make stationary statistical models (typically, calibrated offline) highly inaccurate and rapidly obsolete. The most practical approach to deal with that is to use simple online time-window analytics (running in-stream and re-calibrated every time a window is finalized) and then leverage correlation/aggregation over multiple scopes (such as, anomalous event clustering over a compact subspace of scopes).
Approach
Going over the different ways we could meet the aforementioned challenges, we came down with the following fundamental principles for the architecture of our service:
-
Distributed stream processing at the core: that was an obvious choice, to address the main challenges mentioned above. Apache Flink provided us with built-in solutions for most of them, such as: distributed stream state management, exactly-once processing with Kafka and flexible key-by stream grouping. Some of the critical features, such as automatic handling of a menu of stream join options and aggregating time-window operations, were distinguishing hallmarks of Flink, giving it a unique advantage over other streaming platforms. Moreover, low-level stream APIs allowed us to implement customizations, such as: two-phase-commit sink to our alert notification service sink, custom sliding-count windows, exactly-once bulk-write of Parquet files to S3, inference model serving, metadata flow sourcing and custom process-function handling of stream joins.
-
Cloud-native multi-tenancy from the ground-up: we realized that our clients (internal Salesforce teams and Salesforce customer success analysts) have vastly different needs for log intelligence in terms of log volumes, applications, analytics, compute resources and visualization. As a result, we built a cloud-native, elastic infrastructure with multi-tenant platform running on top of it: each tenant has resource, config, pipeline and data ownership/isolation. Flink helped us to develop it with built-in support for running in multi-tenant compute clusters (like Kubernetes, Mesos and Yarn) providing a separate Application Master/Flink environment per tenant. We have streamlined new tenant onboarding through a set of generic, configurable Flink jobs with templated configs managed through our onboard, release and deploy playbooks. We have built enterprise-grade security features into our platform (leveraging single-sign-on, public-key/certificate, access-list and firewall infrastructure solutions) per Salesforce cloud-native security standards. We plan to allow our service tenants to specify their compute and storage quotas, and then scale elastically within it, providing usage analytical reports on-demand.
-
Keyed window analytics and automated model training: we have decided to leverage Flink time-window aggregation for most of our log analytics. At the core, we compute data sketch distribution of all application performance metrics at all necessary scope levels: this is the bulk of processing done in Flink. Our platform also allows to run simple machine learning models online, at coarse scope levels, to control and augment application performance data sketches, for example:
-
-
dynamic intelligent scoping, choosing scope granularity levels depending on the data stream sparsity (if the stream is sparse, say, over the weekend or for a small organization, reduce scope rather than provide inaccurate statistics).
-
regime-shift identification using sliding time-windows of different lengths (if distributions are vastly different for the same scope across the windows — discard old data sketch and start over).
-
identification of the common baseline and anomalous scopes (using confidence-interval overlaps and largest-common set partitioning techniques).
-
automated discovery of interval processing graph/waterfall structures across dependent metrics (using online techniques similar to classic time-warp analysis).
-
Since our platform is multi-tenant and our time-window analytics are keyed-by for specific scopes, this computational model serves as a simple form of online auto-ML, providing up-to-date, custom-tailored learning in an automated and scalable fashion through Flink.
-
Customer-tailored, state-of-the-art visual presentation of analytical data: one of the most important aspects of the entire service architecture is visual presentation of the log-analytics data to our end users. Our performance insights use case requires interactive BI-style dashboarding with some automatic discovery capabilities and interactive filtering, sorting and drill-down. We have deployed a combination of Apache Druid and Apache Superset for such needs: processed and pre-aggregated data is being fed to Druid from Flink through Kafka with exactly-once processing guarantees. Our real-time anomaly detection use-case also requires alerting, information search and retrieval features to display anomaly-related info. We have deployed the ELK stack solution for that, ingesting event and alert data from Flink using both bulk at-least-once and custom exactly-once two-step commit ElasticSearch sinks. Our clients can freely customize and save their data views starting from our auto-generated dashboards, reflecting their individual user needs. We plan to loosely integrate both of our dashboarding solutions (starting with auto-generated links to navigate across all relevant views in both Superset and Kibana) so that customers get insights about performance and related anomalies, easily switching between dashboards and potentially getting access to full-log-line history of just the anomalous event log lines (which is currently getting lost, per limited global log storage retention policy).
Platform
Our platform has been built primarily with Apache Flink, Kafka, Druid and Superset. Flink jobs do most of the log processing and intelligence, using Kafka to integrate. Druid and Superset power up our performance insights use-case, allowing complex group-by aggregations (e.g. quantile group-by aggregation using data sketches), interactive BI queries (including SQL support) and rich analytical dashboards (including drill-down pivot tables, top-K views, histograms etc.). We also use ELK, namely, ElasticSearch and Kibana, for our real-time anomaly alerting use-case, providing event and alert storage, search and auto-generated alert Kibana dashboards linked within our alert notifications. We deploy our service in a virtual public cloud environment allowing elastic scaling and global availability, while running a secure high-bandwidth duplex data bridge with other major log infrastructure services (some deployed in our private data centers and others running in their own isolated virtual public cloud environments). The diagram below reflects a high-level flow of data and main functions performed within our service. Blue and green flows are powered by Flink jobs, red flows are powered by our data storage and dashboarding tools (S3, Druid, Superset, ELK) and yellow flows reflect semi-offline model training flows (such as anomaly detection statistical model, using our experimental KubeFlow-based model training and serving platform).
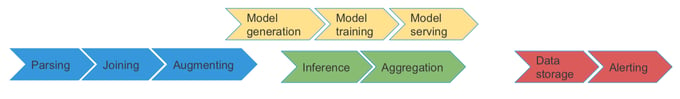
1. Parsing: this step is shared between our Flink cluster and Salesforce’s internal Spark service (which handles basic filtering and schema conversion of the Kafka logs firehose we subscribe to). Our tenants are allowed to use flexible parsing manifests tied to our service’s customizable internal schemas (defined in Protobuf) to represent parsing results.
2. Joining/correlation: joins multiple parser streams and performs key-by data shuffles in real-time. Flink makes this step look easy while doing a lot of heavy-lifting stream processing under the hood.
3. Augmenting: in this step we incorporate all online time-window analytics (customizable by tenants), augment log events with new metric data values and provide direct analytical value to users downstream, in the representation layer.
In our platform, we perform both online and offline analytical model training and that’s why the above data flow forks after the “Augmenting” stage. The pipeline shown in yellow performs semi-offline model training using continuously streamed data from Flink. Most of the steps there are performed using KubeFlow flows and services atop statistical libraries (Sci-kit, MLib, TF, custom Python code — we are polyglot when it comes to data science). The models are periodically re-trained for each tenant flow (some at a coarse scope level, such as per organization ID) and then are automatically served via gRPC-based inference servers (we use MLeap and Seldon). The inference service APIs are available to Flink at the “Inference” flow.
4. Inference: we have built a simple inference client layer in Flink to use with our inference service gRPC APIs. Flink provides several easy ways to integrate async-IO or duplex streaming APIs at scale — so most of the custom code we wrote for this step is a continuous synchronization of the trained model metadata with internal Flink stream state so that proper models can be selected and corresponding inference APIs can be invoked.
5. Aggregation: all of the previous functions operate on per-event basis (a collection of data parsed from multiple log-lines with the same correlation ID), including augmented data (which is computed on per-window basis and appended to each applicable event). Aggregation combines multiple events using flexible, tenant-configurable, thresholded rules to produce aggregated multi-dimensional object schemas that our presentation storage layer can ingest.
The last two steps are performed entirely in our front-facing presentation layer: processed log analytics data is continuously ingested into a handful of user-facing data stores we maintain for our real-time anomaly alerting, performance insights BI and cold/archive storage. User-facing interaction (such as alert notification) and visualization (dashboarding) is powered by the query capabilities of these stores. Exactly-once ingestion semantics is crucial: we try to leverage Kafka as much as possible (for example, Flink->Kafka->Druid ETL guarantees exactly-once ingestion from Flink to Druid out-of-the-box). We had to provide a customized two-phase commit sink to ElasticSearch for our alerting use-case to avoid duplicate alerts while using the standard bulk-write, at-least-once ElasticSearch connector for processed log events. Another key requirement is interactive-time (sub-second to a few seconds) ad-hoc queries which power user dashboards: Druid is known for its blazing-fast roll-up query times (given a reasonable time interval to query over a subset of historical Druid data segments), and ElasticSearch can handle both fast retrievals and full-text search allowing real-time anomalous log search experience similar to the core log search function available within the Salesforce log infrastructure.
Conclusion
Flink has some unique characteristics and performance that allowed us to build our log intelligence analytics platform at the cutting edge of what is currently possible in distributed stream processing, while meeting the scale and requirements of a global technology enterprise like Salesforce. Our clients responded with a strong approval of the new user experience we provide for log analysis, which dramatically reduced the amount of time and effort spent analyzing global applications’ performance for the entire Salesforce client base and applications ecosystem. If you would like to find out more information about how Salesforce is using Apache Flink for application log intelligence, you can watch the recording of our session at Flink Forward Europe 2019.
This article first appeared on the Salesforce Engineering blog. It was reproduced here with permission from its author.


You may also like

Meet the Flink Forward Program Committee: A Q&A with Lorenzo Affetti
Outrun Fraudsters with Agentic AI and Ververica
KartShoppe: Real-Time Feature Engineering With Ververica