Autoscaling Apache Flink with Ververica Platform Autopilot
With the release of Ververica Platform 2.2 in August 2020, we introduced Autopilot, a feature designed to automate the operationalization of Flink applications in production. With its current version, Ververica Platform automates the autoscaling of your Flink applications in a few simple easy steps. In this article, we discuss why autoscaling in Apache Flink is necessary and we take you through our journey of designing and building Autopilot in Ververica Platform. We finally discuss some of our future plans, ideas, and the functionality we plan for the next versions of Autopilot that aim to automate the many operational tasks of stream processing applications with Apache Flink.
Why do you need an Autopilot for Apache Flink?
Before diving into the specifics of Ververica Platform Autopilot, let us take a step back and discuss why an Autopilot for Apache Flink is even necessary and why you should care about it early on. Stream processing applications are long-running and continuous by nature. As a result, the applications’ workloads will vary significantly over their lifetime due to, for example, changing load patterns (because of seasonal external factors, specific days of the week, etc.), or because one of the supported products or features might be gaining additional popularity over time, or finally due to a sudden and unexpected surge in the processing of real time data. Running your stream processing applications in production also means that your data engineering and DevOps teams need to ensure not only optimal end-to-end latency and throughput but also the optimum cost efficiency and resource utilization in terms of, for example, the number of CPU cores being utilized or the memory consumption of your stream processing applications.
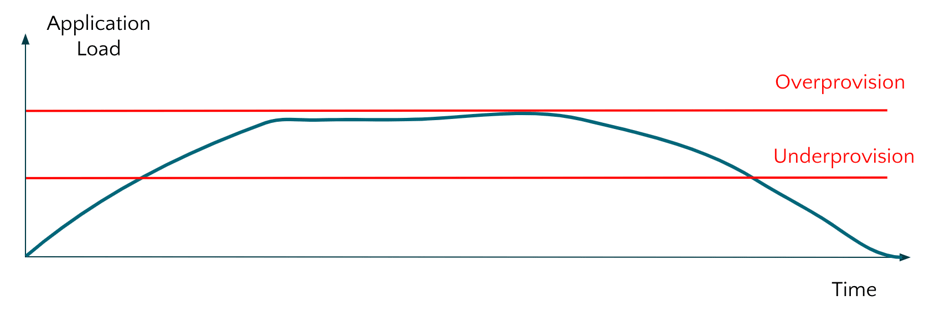
Additionally, due to varying loads or data traffic in your streaming applications, you will need to keep in mind what the optimal resource utilization for your stream processing applications might be. In Figure 1 below, we explain two available options you can choose from:
-
Overprovisioning your application to the peak traffic to ensure that specific end-to-end latency requirements are being met at all times. This option, although resulting in optimal behavior across all expected scenarios, is neither cost-effective nor optimal in terms of resource utilization.
-
Provisioning your streaming application for half of the expected peak load/traffic for better cost efficiency and resource footprint. This solution, although being more efficient in terms of cost, can result in introducing backpressure during times with increased load or having data that is not immediately processed by Apache Flink and is being kept in some sort of message broker or queue for a longer period of time resulting in breaking your latency or throughput SLAs.
 Figure 1: Varying Application Load over time
Because of all the above, having a mechanism that can automatically adjust and scale (upgrade or downgrade) your Flink applications in an automatic manner is paramount and a ‘must-have’ to ensure optimal application performance. To overcome this challenge of successfully scaling your Flink applications over time, Ververica Platform Autopilot comes to the rescue! Autopilot dynamically and automatically scales your Apache Flink application to ensure that specific SLAs are being met with an optimal resource utilization/footprint. Let us now describe the process of scaling your Flink applications, when you should consider scaling your application and where you can scale your application to.
How to scale your Flink Applications
When you want to scale/rescale your stateful stream processing application in Apache Flink, you will need to perform the following steps:
-
Stop your application and trigger a savepoint
-
Write your application state — store in the savepoint — in a distributed file system or object store
-
Load the state from the distributed file system and reassign it to the scaled operators.
For more information and a deep-dive into rescaling application state in Apache Flink, you can refer to this post here. In general, transferring application state to and from operators are expensive operations that should ideally be minimized to ensure optimal resource utilization in your technology stack.
When designing and building Ververica Platform Autopilot we looked at the granularity of the scaling process with the aim to minimize the overall scaling steps. In our design process we had to choose among three options:
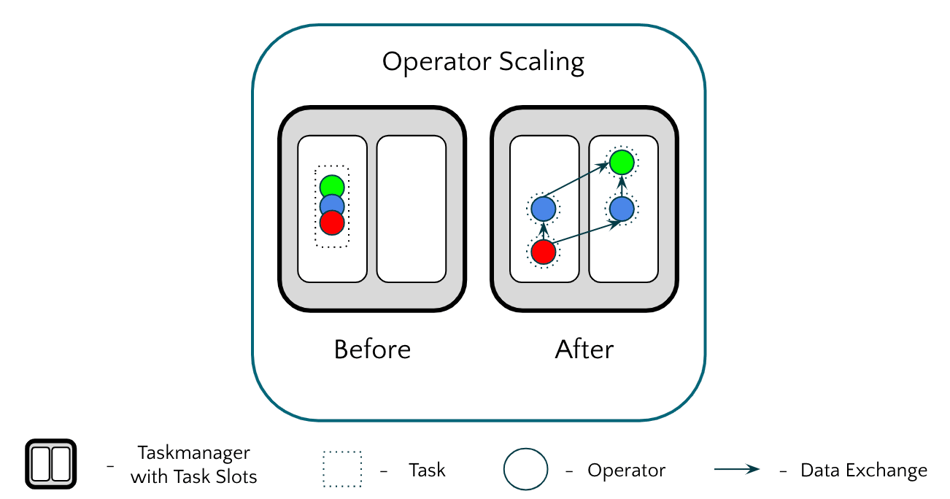
- Operator scaling: The job graph of your Flink application comprises multiple operators, making them the lowest, most granular level of your application. We tried scaling the operators of the graph (illustrated in Figure 2 below) but were faced with some significant downsides, namely breaking the operator chaining which led to multiple operators working on the same task, resulting in inter-process communication which we wanted to avoid.

Figure 2: Operator Scaling in Apache Flink<
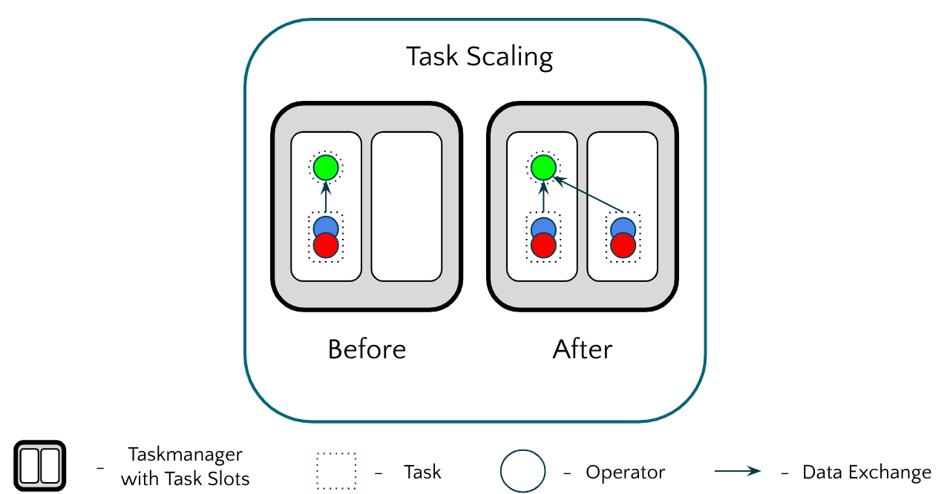
- Task scaling: The second alternative we looked into was task scaling in a Flink application. Although we initially saw some increased scaling and performance, we were later on faced with task slots being unbalanced which can result in task managers being unevenly balanced that can consequently result in severe scheduling problems among task managers.

Figure 3: Task Scaling in Apache Flink
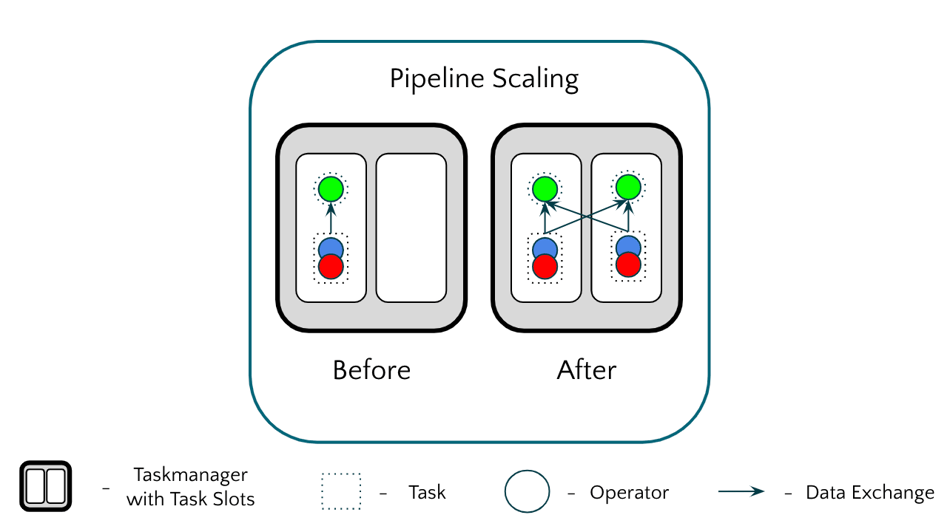
- Pipeline scaling: The third and final alternative we looked into was scaling the entire pipeline. With pipeline scaling, we were able to achieve an evenly-balanced load across tasks and operators. In contrast to task scaling, we might create unnecessary non-load intensive tasks that can be neglected due to the low resource footprint.
 Figure 4: Pipeline scaling in Apache Flink
When to scale your Flink Applications
Now that we have established our preferred mechanism for scaling a Flink application in Ververica Platform it is time for us to explore when is the right time to scale a Flink application. For this, we firstly looked at the CPU utilization of the application. At first sight, we thought that if the CPU utilization is increasing or decreasing we are getting a good overview of the current state of the application. This proved to be wrong because CPU utilization seems to be rather difficult to measure in virtualized environments and the async I/O is not always represented in the CPU utilization metrics because other systems might be covering the backpressure.
As a solution, we looked at the idle TimeMsPerSecond metric. With this metric, an operator is essentially counting the time that it has remained idle (hasn’t processed any events or performed any other activity). With the idle TimeMsPerSecond metric, we can now understand the capacity of each task in our pipeline for every given point-in-time. However, the idle TimeMsPerSecond metric has specific limitations, since you cannot compute and directly derive the appropriate parallelism for scaling your application. As the name of the metric already suggests, only numbers between 0 and 1000 are emitted. Taking for example the increasing load in a pipeline, this might lead to all operators in the pipeline reporting 0. In such an instance, the Autopilot cannot track any gradual increase in the load and therefore cannot determine the needed parallelism. A way to alleviate this could be using some probing technique which is very inefficient due to the high number of rescaling operations.
Where to scale your Flink Applications
We have now identified that the idleTimeMSperSecond metric is useful, but needs to be used in conjunction with a different metric that can provide the information we need to confirm where the application should scale to. For this, we used the connector metrics stored in the Kafka connector, as an example. We specifically looked at Apache Kafka’s internal metric describing the lag. What lag means in Kafka is the number of records that are stored in Apache Kafka and are not being processed immediately. Using this metric can help us define a backpressure-free state in our application by ensuring that the lag metric in Kafka is either remaining stable or has a value of zero.
 Figure 5: Using the lag metric in the Kafka connector to determine when a Flink application is moving from a backpressure-free to a backpressured state.
Ververica Platform Autopilot future direction
What you can now experience in Ververica Platform is the Ververica Platform Autopilot cockpit that gives you some real time insight into how each of the sources is impacting the overall resource utilization of your Flink application. Based on this information you can identify the capacity of each of the sources, how much you need to scale your application and what is its current state. Looking at potential developments for the Ververica Platform Autopilot, we are going to incorporate more connector metrics — beyond Apache Kafka — in upcoming releases. As the Apache Flink community is working on FLIP-27 that refactors the source interface and FLIP-33 which introduces standardized connector metrics, we expect to have some generalized notion of lag for all connectors in Apache Flink that we can also leverage for the Ververica Platform Autopilot. Additionally, upcoming releases of Ververica Platform are going to not only include horizontal scaling but also vertical scaling of your Flink applications, meaning that you no longer have to continue adding task managers to your graph and decreasing the parallelism (something not ideal in many cases because of increased cost for you virtual machines) but rather spawn larger task managers in the first place. In the long term, we are also working on giving our customers the option to dynamically scale their entire pod instead of task managers and also minimize the downtime of your application by ensuring that new task managers can be added to the job graph before scaling up your Flink application.
For a deep dive into Ververica Platform Autopilot, you can check our documentation or directly contact our team here.
You may also like

The Data Platform Bar Has Risen. Ververica Has Set It: Introducing Ververica Platform 3.1
Discover how Ververica Platform 3.1 elevates stream processing with enter...

Your AI Coding Assistant Can't Touch Your Streaming Platform. Until Now
Power your streaming data platform with Ververica's MCP server for AI-nat...

Zero Trust Theater and Why Most Streaming Platforms Are Pretenders
Most streaming platforms fall short of true Zero Trust and operational re...

No False Trade-Offs: Introducing Ververica Bring Your Own Cloud for Microsoft Azure
Ververica introduces BYOC for Azure, delivering enterprise-grade streamin...


